Two Measures of Route Service Quality
Creating and maintaining quality fixed route service is complex. The first, strategic step, is to create the fixed routes for your system in combination with service times and corresponding allocation of bus capacity (number and size of buses). Next, at the more tactical level, there are two aspects of service quality that should be monitored — bus load and frequency.
Load, or the occupancy on board your buses, should be monitored to ensure a fixed route has the right number and size of buses during service. Do your buses get too crowded too often? Are there times when you are wasting capacity?
Frequency of service measures how often buses arrive at each stop along a fixed route. The right cadence means your service is viewed as useful, efficient. and convenient.
BusGenius offers accurate analytics and reports to monitor and measure your Load and Frequency of service, ensuring you’re meeting the expectations and needs of your ridership.
BusGenius analytics on bus load.
The Load, or on-board ridership, can be viewed for a route over some time span in two ways:
Heatmap: Our Bus load heatmap shows the relative occupancy over the day for all buses on a selected route. Dark regions indicate that more buses within a time period (horizontal axis) have the load indicated on the vertical axis, whereas lighter regions indicate fewer buses with the indicated load.
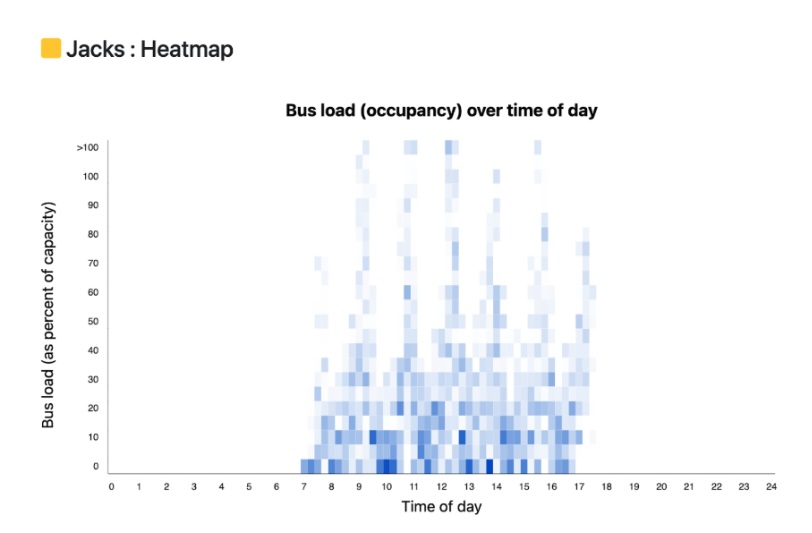
For example, a darker region that is positioned low on the vertical axis indicates many buses of low occupancy at the indicated time period; whereas, a darker region positioned high on the vertical axis indicates many buses of high occupancy at the indicated time period. Most of the darker regions above are low on the vertical axis, indicating low bus load. This could mean there is too much capacity on the route for the ridership demand, and could indicate an opportunity to remove a bus from the schedule or reduce bus size.
Histogram: The following histogram shows the relative bus-hours spent at given loads (occupancy).
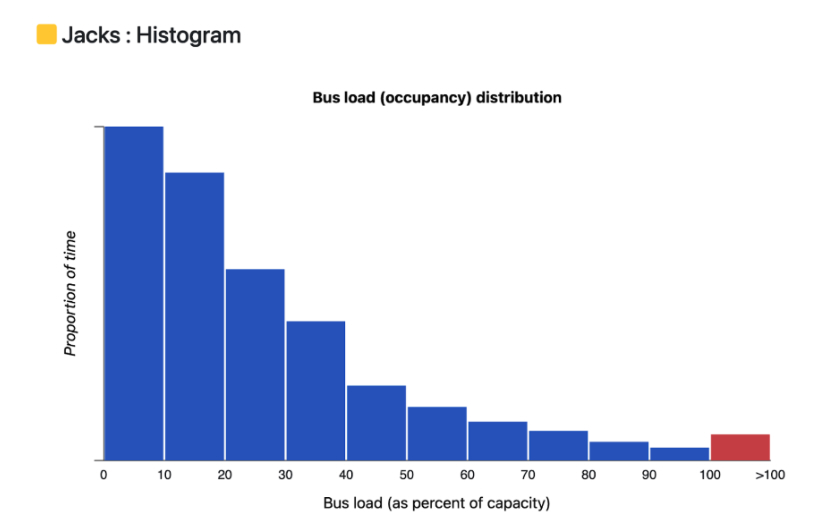
For example, a tall bar indicates many bus-hours spent with load indicated by the horizontal axis. A short bar indicates relatively few bus-hours spent at the load indicated. Here, most bus hours were spent with low load.
One probably does not want too much over-crowding on buses, but every transit system must balance load with frequency of service.
BusGenius analytics on bus frequency
There are two aspects to consider on frequency of arrivals/departures to stops along a fixed route. The first is the average frequency … with a given number of buses and an estimate of route cycle time, the average frequency can typically be fairly well controlled and planned over some time span. However, problems arise when disruptions cause buses to bunch. For example, two buses that arrive at a stop together, leaving a trailing gap that is much larger than the average frequency. So effective analytics must examine more than just average frequency … we will highlight two of our reports that help you understand the variability of arrivals and when issues occur.
Service Gap Report: This first analytical report to examine frequency is our Service Gap report. It details the service patterns of buses to a particular stop over some time frame with respect to a configurable service gap goal. For example, a goal at a stop may be that the time without a bus at the stop should not exceed 6 minutes. Here is an example
The report begins with summary statistics. In this case we observe that the specified 6 minute arrival goal is met 75% of the time. We also note that, on average, bus service occurs in just over 5 minutes. The issue is that buses do not always arrive in a steady fashion … sometimes they are bunched up, resulting in almost 25% of the visits not meeting the 6 minute goal. And one time a gap of over 15 minutes occurred!
The report continues with a histogram that buckets the 105 total visits:
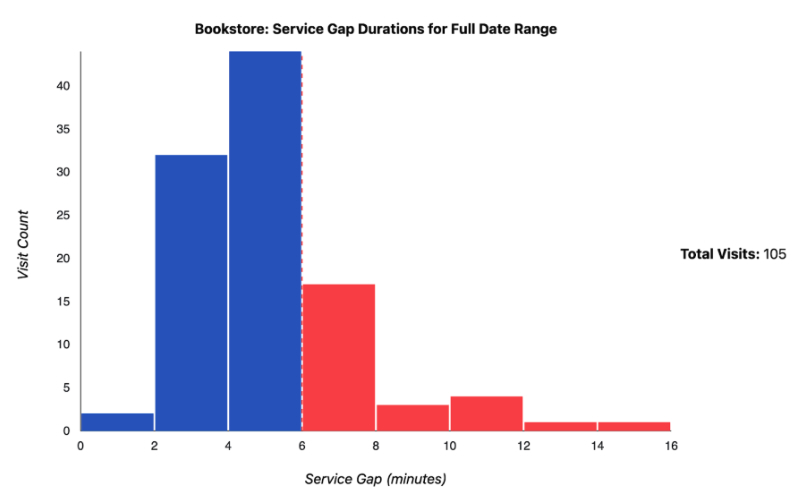
The gaps in service that exceed the goal are highlighted in red. We observe a few visits in the 0-2 bucket. This indicates that although the goal for these visits are easily met, the service is TOO frequent, indicating that buses were bunched.
This report offers even more details on what times red service gaps occurred … at night? lunch time? during shift changes? And even allows our clients to dig into every visit, the bus, the driver, etc to understand why service lapses occurred. Such reporting has resulted in actionable improvements in bus/driver scheduling — for one client this resulted in an improvement from 70% to consistently close to 90% of visits meeting their service goal!
Headway Performance Over Day: The second report details the overall cycle time of a route throughout the day, the number of buses on route over time, and the gap or headway between the buses; and finally, if the buses bunched up or instead provided reliable and steady service.
Here is an example from the same route/day as depicted in the report above.
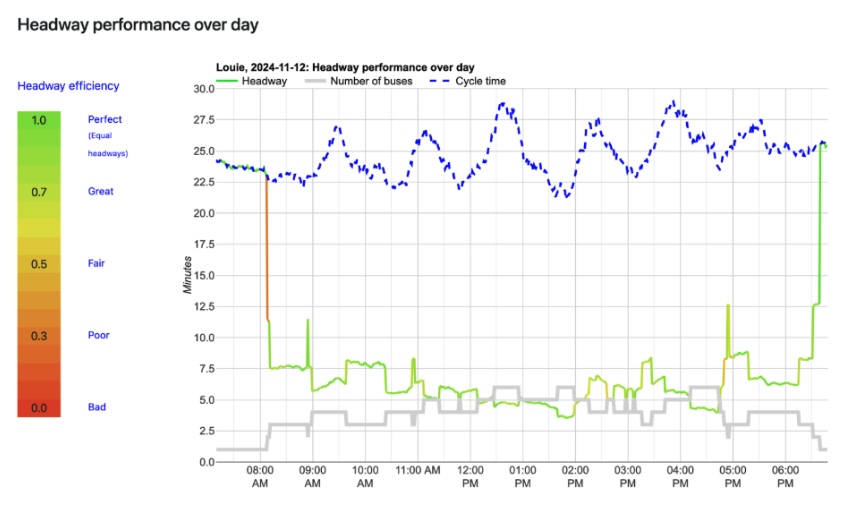
The dashed blue line shows the cycle time (time to loop the entire fixed route) as it fluctuates over the day. This is for a university, and the periodic blue line corresponds to the predictable fluctuations whenever classes change. The grey line near the bottom shows the number of buses on the route over time. The mostly green line shows the average headway time between buses. When the line is bright green the buses are nicely spaced out, but when brown/red the buses are experiencing some bunching, which will lead to gaps in service.
The next step
These reports help clients understand their system needs over the day, how many buses they require, and the level of variability that is impacting their service goals.
Adjustments can successfully be made to bus/driver scheduling to help drive improvements. However, disruptions and shocks will inevitably occur in every system, causing buses to bunch and service goals to lapse.
The only way to combat these disruptions is to make your system nimble, able to respond dynamically, in real-time, to shocks in the field. This can be accomplished with BusGenius Intelligent dynamic headway management: which helps prevent buses from bunching up, and automatically repairs bunching when it occurs. Effective dynamic headway management can keep your service steady and reliable to each stop, meeting service goals, and smoothing out the load on your buses — effectively and efficiently utilizing your capacity.